The short answer is no: you can’t do phrase search on
not_analyzed fields in Kibana (my test is on Kibana3).
The long answer is more interesting. Let us start the story from
the beginning.
I use ELK to
analyze static log files retrieved from customers: I use Logstash to organize
massive logged information into events, such as “DB Connection Error”,
“restart” etc based on regex pattern matching; I use Kibana to display event
histograms and to analyze event correlations. To do histogram on event
field, event
shouldn’t be analyzed, so the mapping template specifies this:
"event": {"type": "string", "index": "not_analyzed" }
Kibana
issues the following histogram aggregation request to ElasticSearch:
{"query": {"filtered": {"query": {"bool": {"should": [{"query_string": {"query": "event:restart"}}]}},"filter": {"bool": {"must": [{"range": {"@timestamp": {"from": 1416960000000,"to": 1417046400000}}}]}}}},"aggregations": {"0": {"date_histogram": {"field": "@timestamp","interval": "10m"},"aggs": {"1": {"terms": {"size": 200,"field": "event"}}}}},"size": 0}
So far, everything
seems normal, here comes the twist of the story. Suppose there are a few “DB
Connection Error”, “restart” and other events in ElasticSearch, the below table
shows the result for different query strings.
Query string
|
result
|
"event:restart"
|
Correct result
|
"event:rest*"
|
Correct result
|
"event:\"DB Connection Error\""
|
Correct result
|
"event:DB Connection Error"
|
Incorrect Result
|
"event:DB Connection"
|
Incorrect Result
|
"event:DB*"
|
Zero Result
|
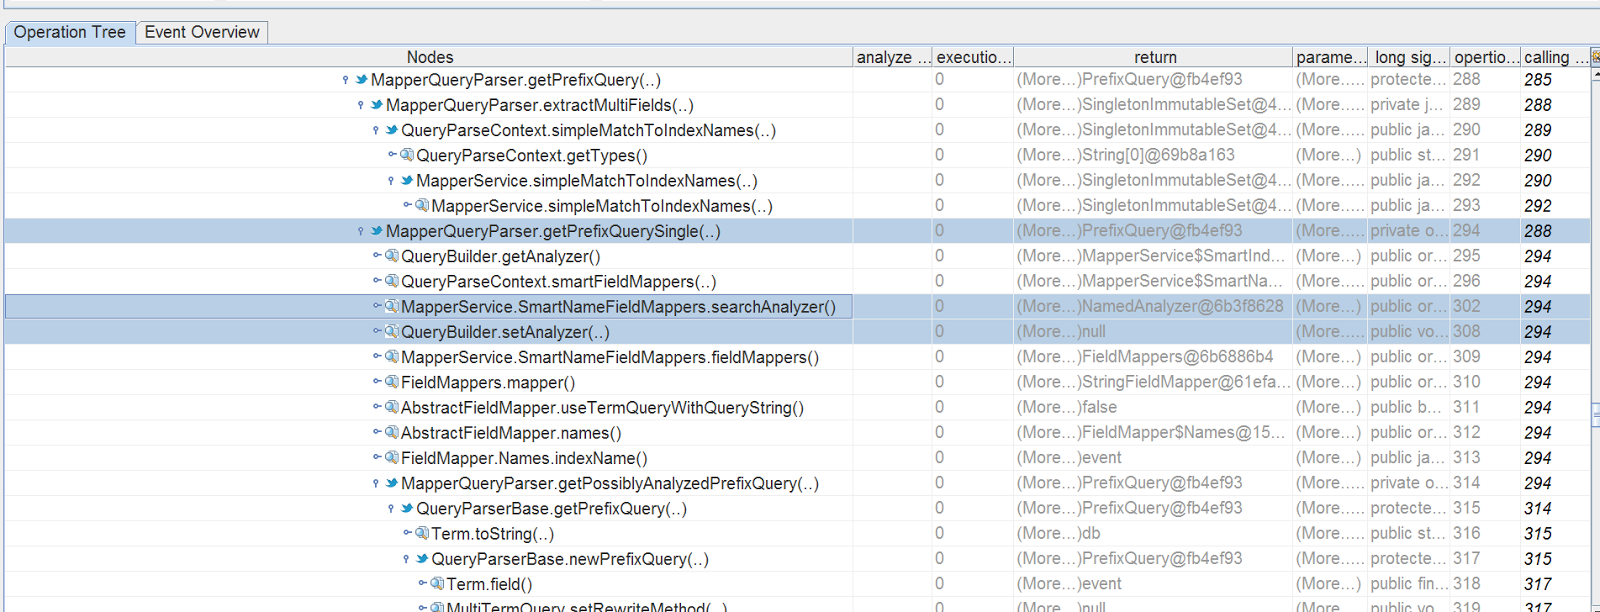
I couldn’t
reconcile these different results, so I used PerfSpy to capture the code track,
and discovered how ElasticSearch deals with query string.
"query":
"event:DB Connection"
For query
string "event:DB Connection",
ElasticSearch constructs a BooleanQuery with two TermQuery, notice the
second TermQuery’s field is “_all”, not “event”, surprise!
This solves
the mystery why "event:\"DB Connection Error\"" gets
correct result, while "event:DB Connection Error" and "event:DB
Connection" not.
What about "event:DB*"?
"query": "event:DB*"
The mystery is
solved. ElasticSearch constructs a PrefixQuery, however the query text is db,
not DB.
PrefixQuery
is case sensitive, it lowercases query text. Since event field is not analyzed,
“DB Connection Error” is stored as “DB Connection Error”, so “db*”
doesn’t hit anything.
Keyword tokenizer + lowercase filter
The solution
for “db*”
is easy, what is needed is an analyzer that does lowercasing but nothing else.
Add such an analyzer into the mapping template:
{"template" : "logstash-*","settings" : {"index.refresh_interval" : "5s","index": {"analysis": {"analyzer": {"lowcasekeyword": {"type": "custom","tokenizer": "keyword","filter": ["lowercase"]}}}}}…."event": {"type": "string", "analyzer": "lowcasekeyword" },"subevent": {"type": "string", "analyzer": "lowcasekeyword" }
When constructing
a query, ElasticSearch will consult the field mapping and use the same analyzer
to analyze the query string:
But there is
still no way to do “DB Connection*” type of search.
You can test
all these out following http://www.gossamer-threads.com/lists/lucene/java-user/243973.


No comments:
Post a Comment